
In this blog, I don’t really want to talk about image editing tools specific to a single piece of software. However, the tool I want to talk about today can be found in just about every piece of image editing software out there, and that is the curves adjustment tool.
The curves adjustment is one of the most universally used, one of the most versatile, and one of the most powerful tools there is but many people get confused about how it works.
What does the Curves Adjustment do?
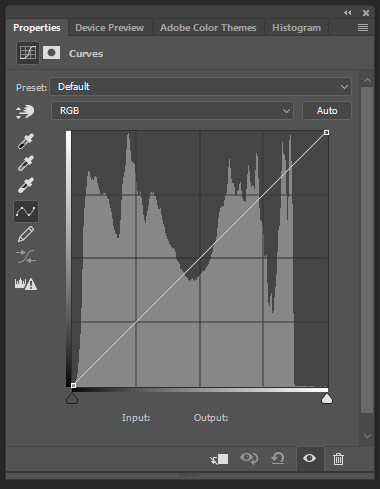
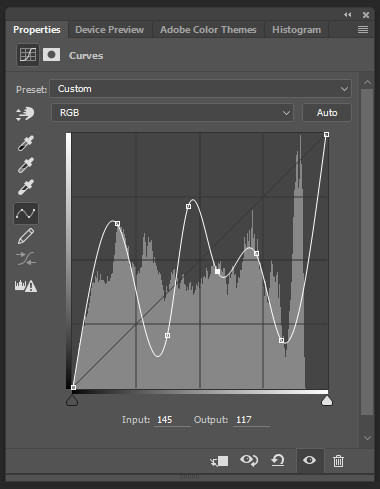
The curves tool is an editing tool that lets you adjust the colour channels either individually or all together. Here is the curves tool from Photoshop. Don’t worry if you don’t use Photoshop as the tool is almost identical in other pieces of software.
First, I will describe the main features of it.
Channel Selector: At the top of the tool is the colour channel drop down which is currently set to RGB. This is the default setting as it allows you to alter all 3 colour channels together which allows alteration of the luminosity. This is the setting I want to talk about first.
Histogram: In the center of the tool is a histogram. I wrote a post explaining histograms here, so if you don’t understand them give it a read. Depending on the channel selected, depends on the histogram shown. As RGB is selected, it shows a luminosity histogram i.e. the distribution of lights and darks in the image.
The Curve: The actual curve in the curves tool is the part which the user adjusts. However, it does not start out as a curve but as a diagonal line running from the bottom left to the top right corner.
These are the primary parts you will find on most curves tools. Now let’s look at using the curves tool.
Adjusting the Curve
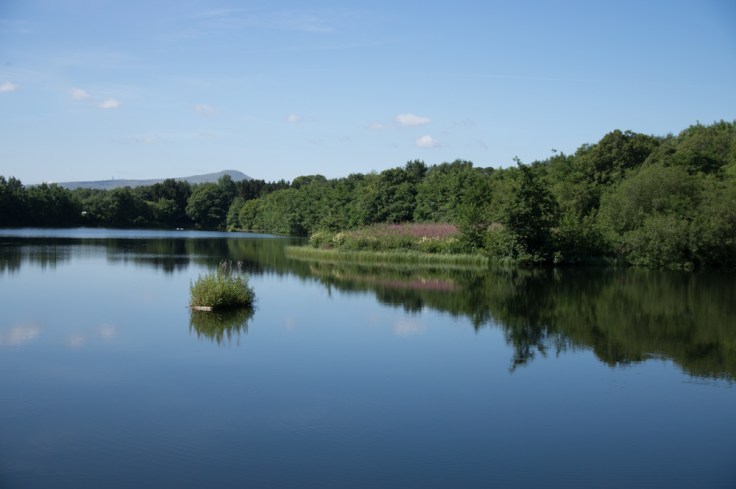
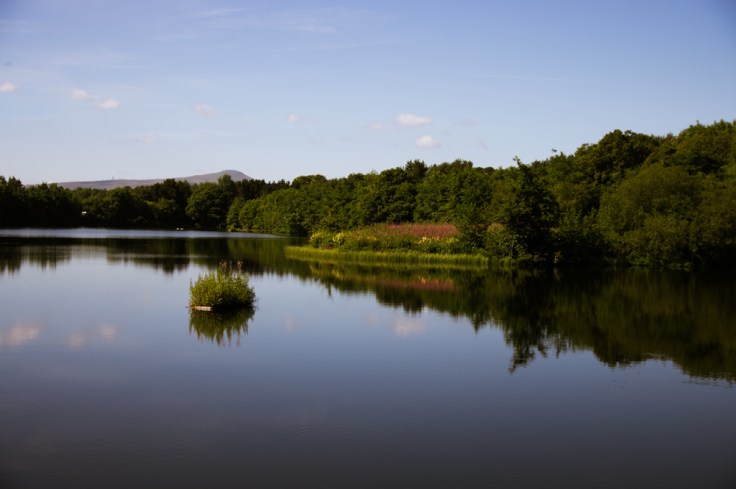
To show the effects of using this tool, I will first show you the image I am going to use. The curves tool shown above (and it’s histogram) is taken from this image.
RGB / Luminosity Adjustment
With RGB selected it allows you to alter all three colour channels together. This effectively means you alter the luminosity in the image when you adjust the curve.
To use the curves tool, you click on the curve and drag it around to make changes. Here is the curves tool for the above image to remind you.
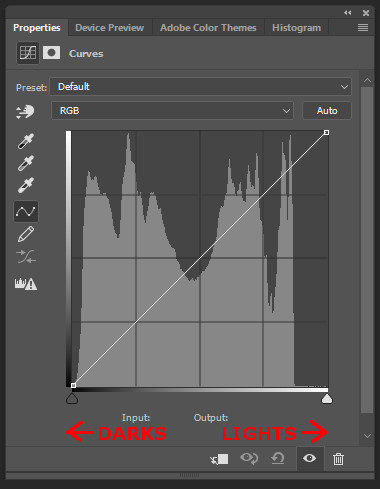
The histogram on the tool shows the distribution of lights and darks, with the darks at the left working to the lights at the right. Thus if you manipulate the tool at the left side it will affect the darks more, and at the right side, it will affect the lights more.
By moving the curve upwards, it increases luminosity. By moving moving it downwards it decreases luminosity.
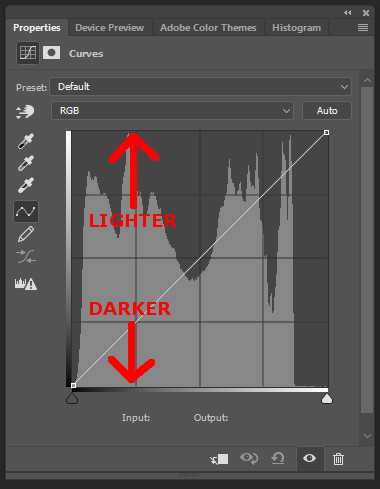
To actually use the tool, you click on the diagonal line and drag it about.
Boost Highlights
The first thing I want to do is to boost the highlights in the image. Thus, I click on the diagonal line near the right side and drag it upwards like so.
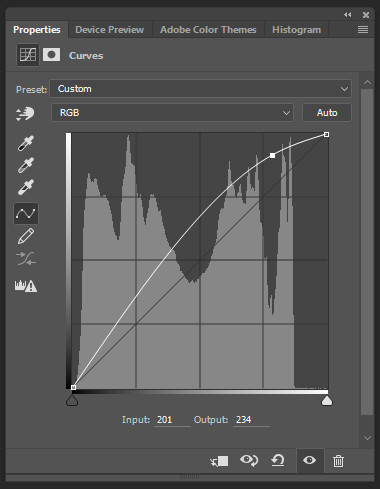
The curves now shows which areas will be affected. The parts of the curve which deviate from the diagonal baseline will be affected more. This is really the important part in understanding curves. To understand the changes you have to read the histogram and analyse the deviation of the curve from it’s diagonal baseline.
Thus, in this example, the midtones to lights will be increased in luminosity more than the darks. And here is the result with the before and after. Notice how the highlights are much brighter, but the extreme darks are affected less.


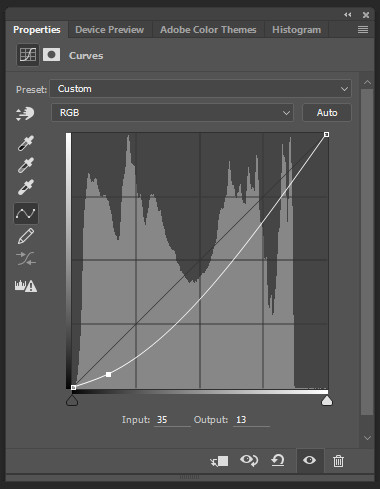
Darkening the Darks
Similar to the above example, I will now manipulate the curve at the left side (the darks) and drag it downwards to darken them further. Again, notice how the curve looks and it’s affect on the image.

Compound Curves
You are not limited to just one adjustment point on the curve, you can create many points are manipulate them. One of the most commonly used is the s-curve. This two point curve boost hightlights and darkens the darks which boosts contrast in the image.
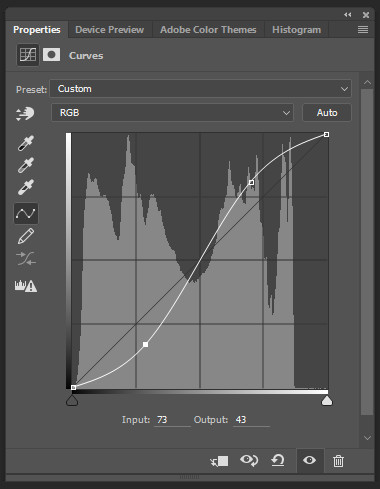

Using an inverted s-curve would have the opposite effect and decrease contrast.
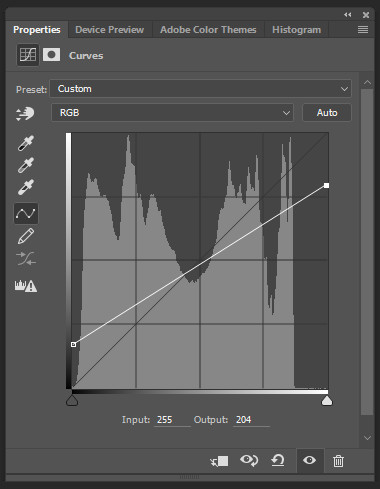
Going to the Edge
In addition, you can also manipulate the curve at it’s left and right extremities. In the example below, I push the far left point up and the far right point down which produces a straight line curve (if that’s possible) which reduces contrast significantly across the whole tonal range of the image.

Why have a curve?
The reason for having a curve is to allow a smooth, gradual change. If you were to be able to edit more specific areas it could have a fairly wild effect. This is because you are editing all three colour channels together, red, green and blue. Whilst this appears to make luminosity changes with a smooth curve, when you make a ridiculous curve with more specific points you can see the impact this has on the colours.

Specific Colour Channel Adjustments
Now lets have a look at adjusting individual colour channels and this might help explain the above example more.

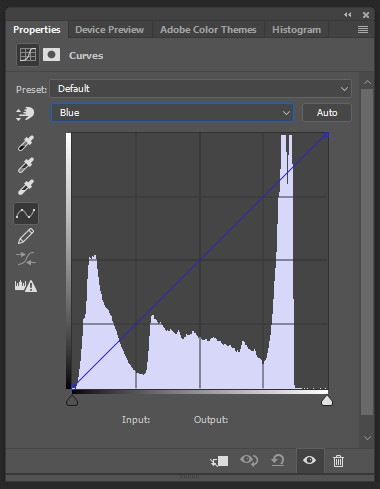
From the drop down I select the blue channel. Notice how the histogram is different from the RGB channel as it now shows the distribution of blues across the tonal range of the image. This is seen with a spike on the far right of the histogram showing the light blues in the water and most of the sky.
Now, we will make adjustments to the blue channel. This is where things get a bit trickier.
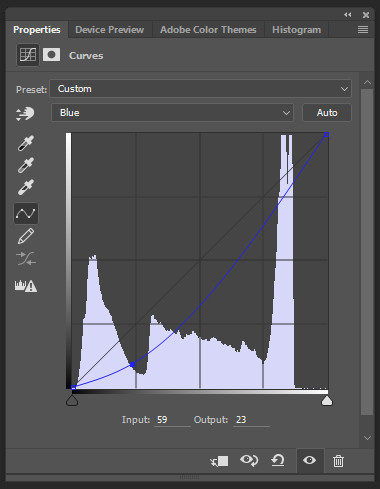
I will reduce the blues in the darkest part of the image but it does not, as you may guess, darken down these blues. What it does is reduce the amount of blue in this area. By reducing the amount of blue it is effectively pushing the colours in this area towards blues complimentary colour which is yellow. Why? Because by reducing the amount of blue you are allowing more red and green (the other two colour channels) to come through, and red+green=yellow.
Here is the curves adjustment and here is the result.

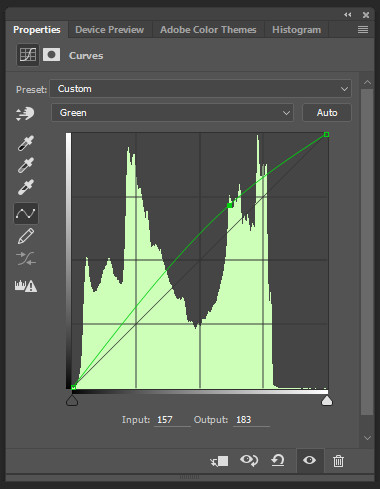
Here is another example. This time I will select the green channel and boost the midtone greens. This basically adds more green into this section of the image.

In one final example I will reduce the blues and reduce the greens slightly. By reducing these two channels it is the same as boosting the third remaining channel of red. Thus, the image’s colours are pushed more towards red.
This may seem a bit confusing so it’s probably best just to remember that the RGB channel alters luminosity, and the individual colour channels alter colour balance. If you want to experiment though, try boosting each individual colour channel by the same amount and you will see and it boosts luminosity as would happen in the RGB channel.
Targeted Adjustments with Layer Masks
Hopefully, I have been able to explain how the curves tool works and you have a general idea of how to use it. The last thing I want to show is how powerful the curves tool can be when used with layer masks to target the effect to specific areas. Layer masks may not be available in all image editing software and if you don’t know how to use them, then here is a tutorial.
So here is the image from above edited with only multiple curves adjustments and no other tool other than layer masks to target each adjustment to a specific area of the image. I hope this demonstrates how versatile and powerful this tool can be.

Thanks for Reading,
Neil


Leave a comment